Basal Body Temperature 2026: Master Your FERTILITY Chart 📋

Your basal body temperature holds the secret to understanding your fertility better than any expensive test. Most women miss the subtle signs their body gives them each month – temperature shifts that predict ovulation with shocking accuracy.
This complete guide reveals how BBT tracking transforms your fertility awareness from guesswork into precise science, giving you the tools to master ovulation prediction within just 2-3 cycles.
What Is Basal Body Temperature?
(The Basics Every Woman Needs)
Basal body temperature represents your body's lowest resting temperature during a 24-hour period. Think of it as your baseline temperature when you're completely still and haven't moved for hours. This temperature gently rises and falls with hormonal changes in your menstrual cycle, providing valuable clues about your fertility.
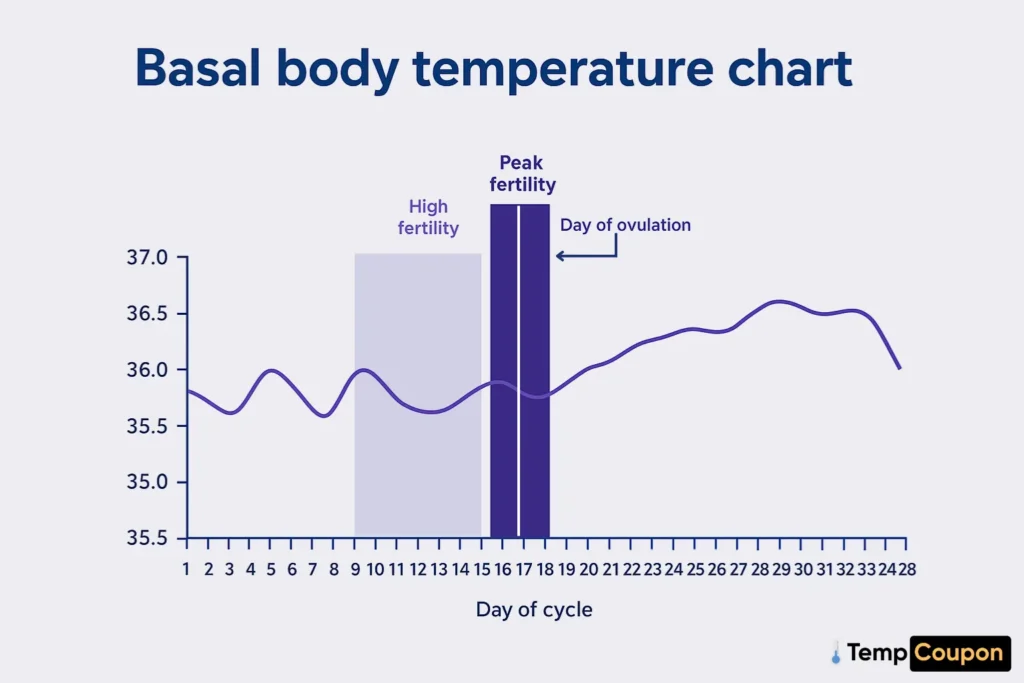
Your BBT baseline temperature typically ranges from 96-98°F (35.5-36.6°C) before ovulation. After ovulation occurs, progesterone rise causes your temperature to increase to 97-99°F (36.1-37.2°C). This temperature shift can be as subtle as 0.4°F or as noticeable as 1°F.
Understanding Your Hormonal Temperature Dance
Your menstrual cycle phases directly correlate with specific temperature patterns:
| Cycle Phase | Temperature Range | Duration | Key Hormones |
|---|---|---|---|
| Menstrual | 96.5°F – 97.2°F | Days 1-5 | Low estrogen/progesterone |
| Follicular | 96.2°F – 97.5°F | Days 6-14 | Rising estrogen |
| Ovulatory | Dips 0.2°F then rises | Days 13-15 | LH surge, progesterone starts |
| Luteal | 97°F – 99°F | Days 16-28 | High progesterone |
This predictable pattern allows you to identify your fertile window retrospectively and predict future ovulation timing after tracking several cycles.
Why BBT Charts Beat Other Fertility Tracking Methods
Temperature Shifts Explained
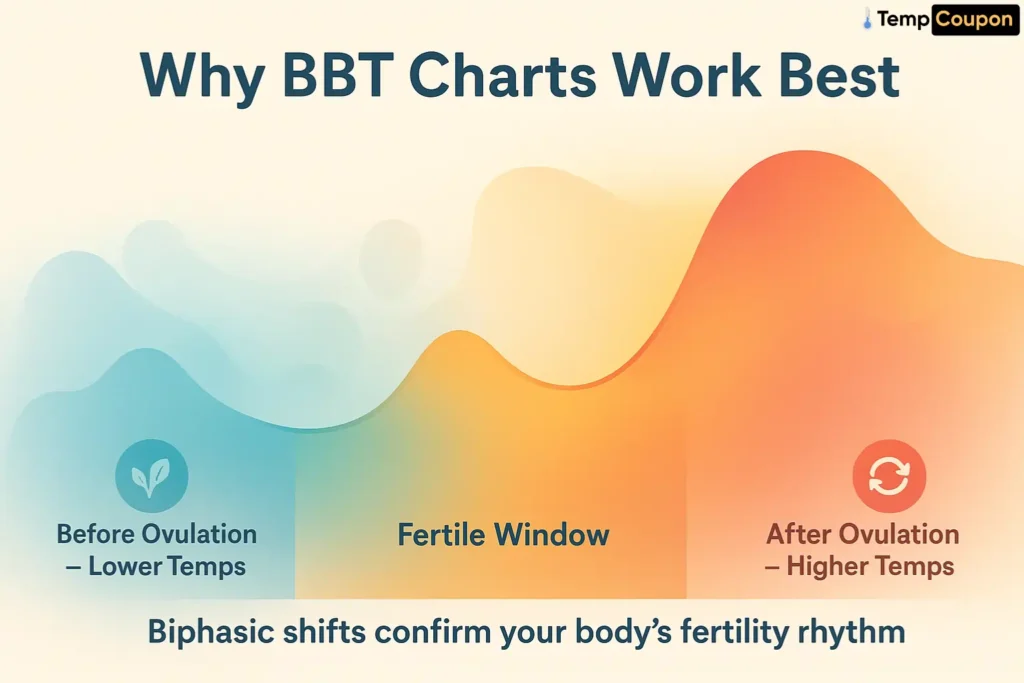
A biphasic pattern—lower temps before ovulation, higher temps after—confirms the body’s hormonal rhythm. The sustained rise proves ovulation took place, while the start of a new cycle resets the chart.
Essential Tools for Accurate BBT Tracking
| Tool | Why It Matters |
|---|---|
| Digital basal body temperature thermometer | Reads to two decimal places for spotting tiny shifts |
| Wearable thermometer like Tempdrop | Captures temps even if you move or wake at odd hours |
| Paper or app-based fertility charting tools | Visualizes the biphasic pattern quickly |
Tempdrop BBT Tracker: Accuracy Without the 5 a.m. Alarm

Tempdrop solves the biggest challenge with traditional BBT thermometer accuracy – the need for perfect timing and sleep conditions. This wearable thermometer continuously monitors your temperature throughout the night, calculating your true basal body temperature automatically.
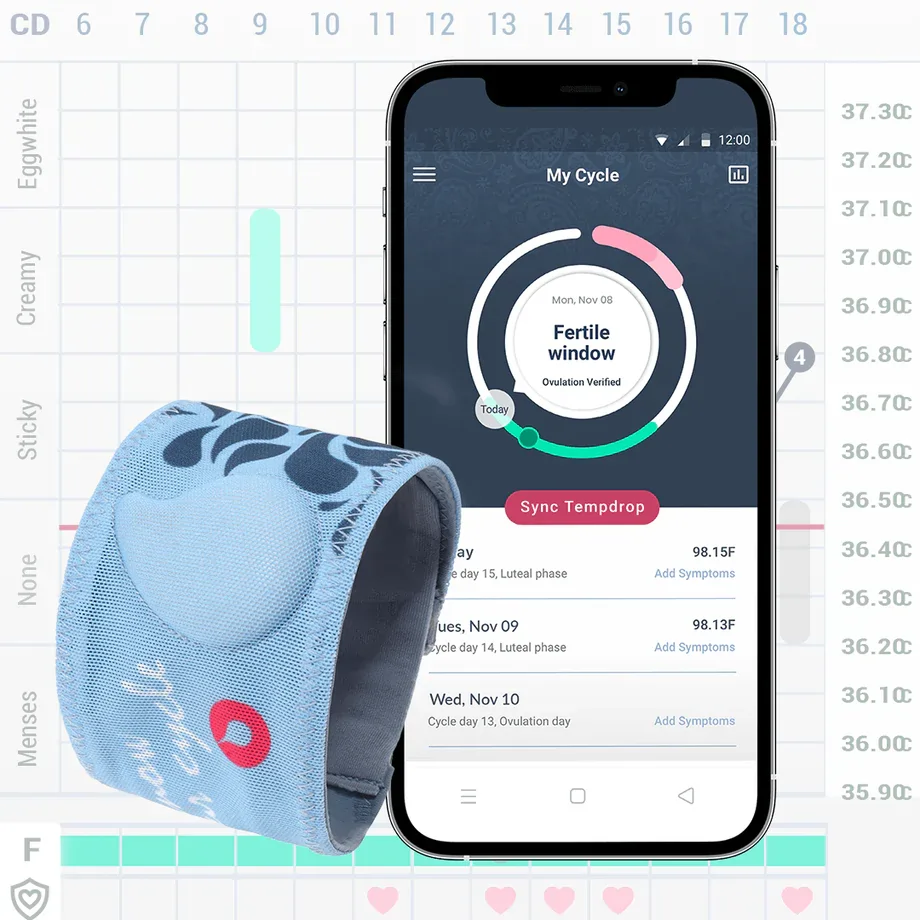
Key benefits include:
Flat 10% OFF on Tempdrop – Track BBT in Your Sleep!
Use code FRIEND-LZBF3H9 to save 10% on Tempdrop, the wearable that monitors your temperature overnight and calculates your true BBT automatically.
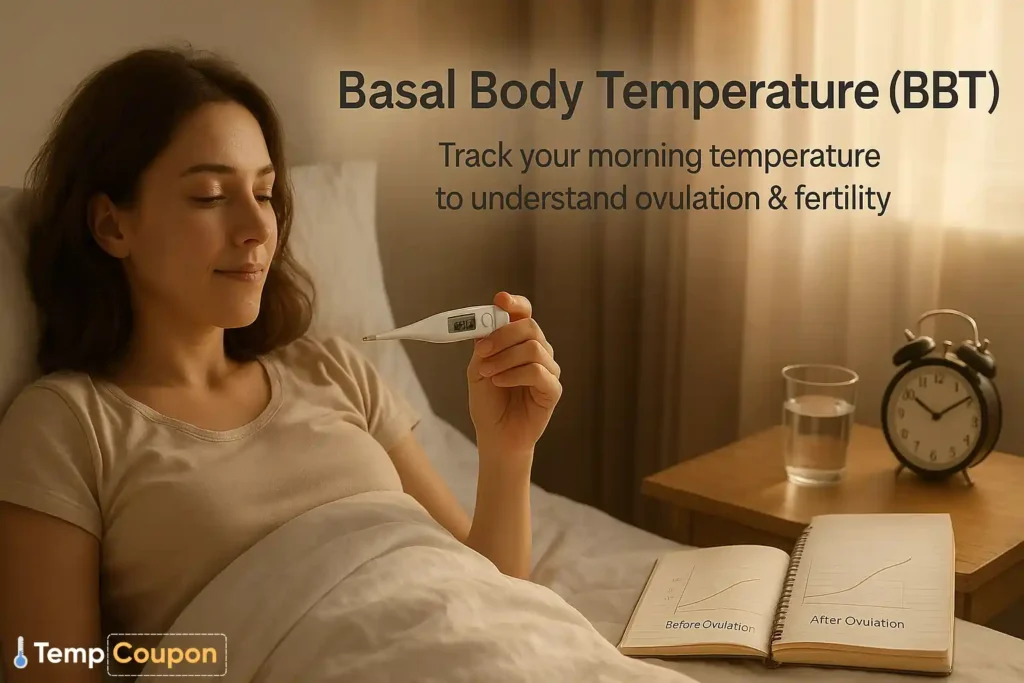
How to Take Your Basal Body Temperature
- Place the thermometer orally (same spot each day) before rising
- Log the reading immediately in your BBT tracking app or paper chart
- Repeat at the same time every morning; a 30-minute shift can alter the reading by 0.1 °F
- Note factors like alcohol, fever, or restless sleep that may skew data
Creating a Consistent BBT Routine
Reading Your Basal Body Temperature Chart Like a Pro
Understanding Temperature Patterns
Your fertility tracking success depends on recognizing specific temperature pattern changes throughout your menstrual cycle phases:
Follicular Phase (Days 1-14)
Ovulation (Day 14-16)
Luteal Phase (Days 15-28)
Common BBT Chart Patterns Explained
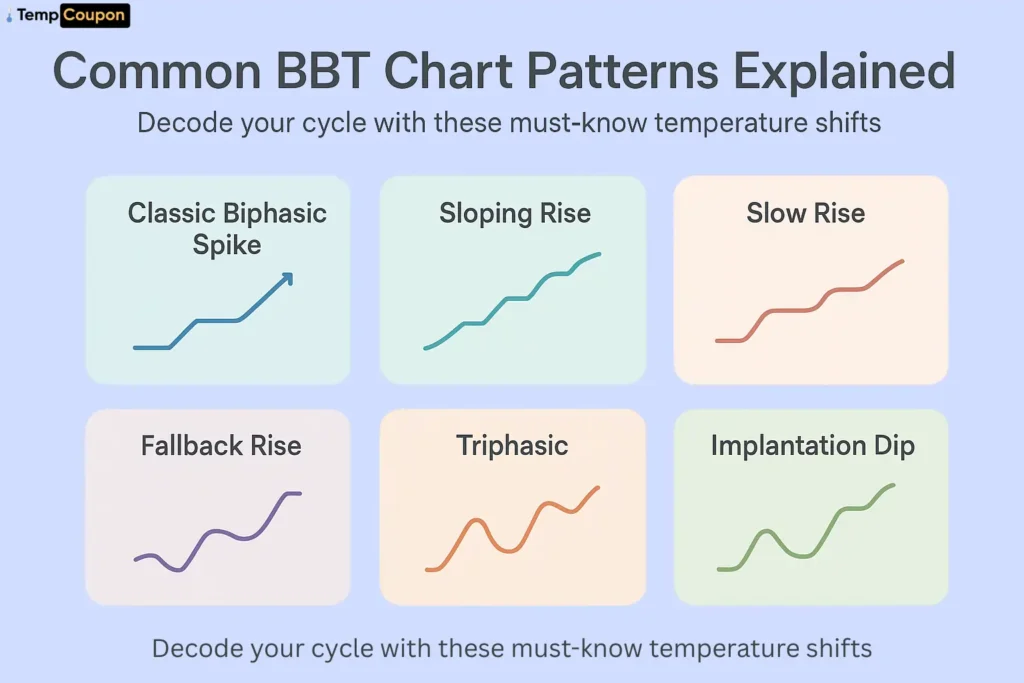
Basal Body Temperature Chart fanatics, crack your cycle code with these must-know patterns:
Stress, travel, or inconsistent thermometer placement can flatten the expected rise. Switch to a wearable thermometer like Tempdrop if daily alarms aren’t realistic.
BBT Tracking Mistakes That Ruin Results
BBT for Specific Situations
When BBT Tracking Isn’t Right for You
Shift workers, chronic insomniacs, or anyone with thyroid disorders may struggle with consistent readings—consider hormonal fertility monitors instead.
BBT Success Timeline: What to Expect
Month 1-2: Learning proper technique and establishing baseline
Month 3-4: Pattern recognition and ovulation prediction confidence
Month 5+: Mastery of personal fertility signs and accurate fertile window prediction
Your basal body temperature charting gives you unprecedented insight into your fertility tracking journey. With the right thermometer (like Tempdrop with our exclusive FRIEND-LZBF3H9 discount), consistent habits, and proper chart interpretation, you'll master ovulation prediction within 2-3 cycles.
Your fertility awareness transforms from confusion to confidence when you understand what your body tells you each morning through natural family planning methods that actually work.
Remember, BBT tracking requires patience and consistency, but the insights into your menstrual health and reproductive patterns make this temperature method invaluable for women serious about understanding their fertility.